

Zebrafish Segmentation - Fluorescence
The Ramona MCAM supports fully automated segmentation of zebrafish from single frame and stack datasets. This functionality can be used to define a region of interest that is the zebrafish and perform further analysis within the region such as bulk fluorescence intensity quantification, blob counting, and region area quantification. When stack datasets are analyzed, contrast is measured within each segmented region and only the best focus frame of the stack is used for further analysis and visualization. For more information on the underlying mechanics of the segmentation workflow, please see the MCAM User Manual.
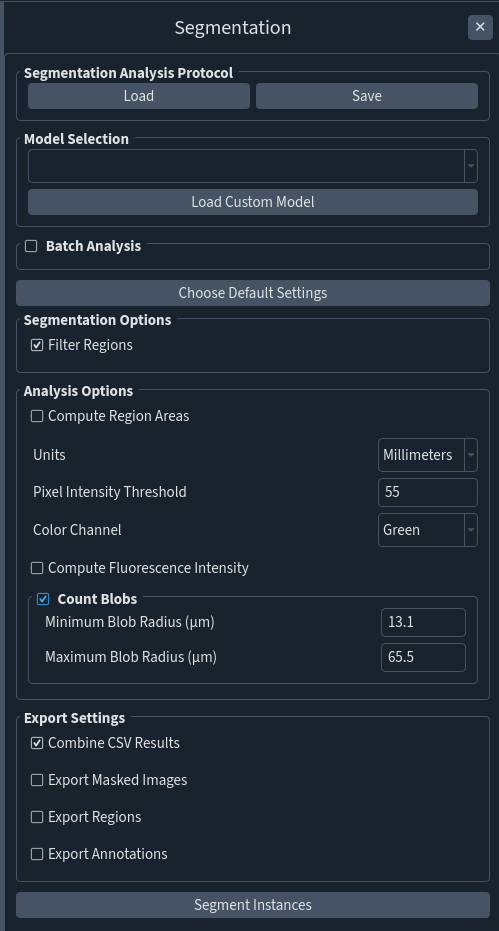
Step |
Function |
|---|---|
1 |
Acquire a XYZ-stack dataset using the XYZ-stack acquisition mode described above. |
2 |
Open the dataset in the MCAM™ Viewer by double clicking on the metadata.nc file or drag-and-dropping it into the viewer. |
3 |
Go to Tools > Segmentation to open the segmentation panel. |
4 |
Select a segmentation model specific to the current segmentation task from the model selection menu. |
5 |
If you would like to compute region areas, check “Compute Region Areas”. |
6 |
Select an SI unit for exported values. “Millimeters” is selected by default. |
7 |
Select a Pixel Intensity Threshold to use for fluorescence intensity and blob count quantification. Values below this threshold will be set to zero while values above remain unchanged. The default value of 55 was optimized for quantification of neutrophils in zebrafish. |
8 |
Select a color channel to be considered during analysis. Green is selected by default. |
9 |
If you would like to compute bulk fluorescence intensity, check “Compute Fluorescence Intensity”. |
10a |
If you would like to count blobs, check “Count Blobs”. |
10b |
If you plan to count blobs, set a minimum and maximum blob radius threshold for the size of the blob you plan to count. The larger this range is, the more computation is required during analysis which will increase analysis time. Consider that the width of one pixel on the screen is approximately 3 micrometers in screening mode but each system is slightly different and for fine-tuning your specific pixel width should be considered. |
11 |
Click “Segment Instances” to run the analysis. |
12 |
Results are output to a new directory with the same name as the analyzed dataset with “_segmentation_results” appended. |
13 |
Segmentation visualizations are displayed in the MCAM Viewer. |