

Channel Threshold Analysis
The Channel Threshold Analysis reports the number of pixels between an upper and lower threshold bound as an area within the image. This analysis is very general and can have many use cases, such as the area of live cells vs. dead cells in a viability assay.
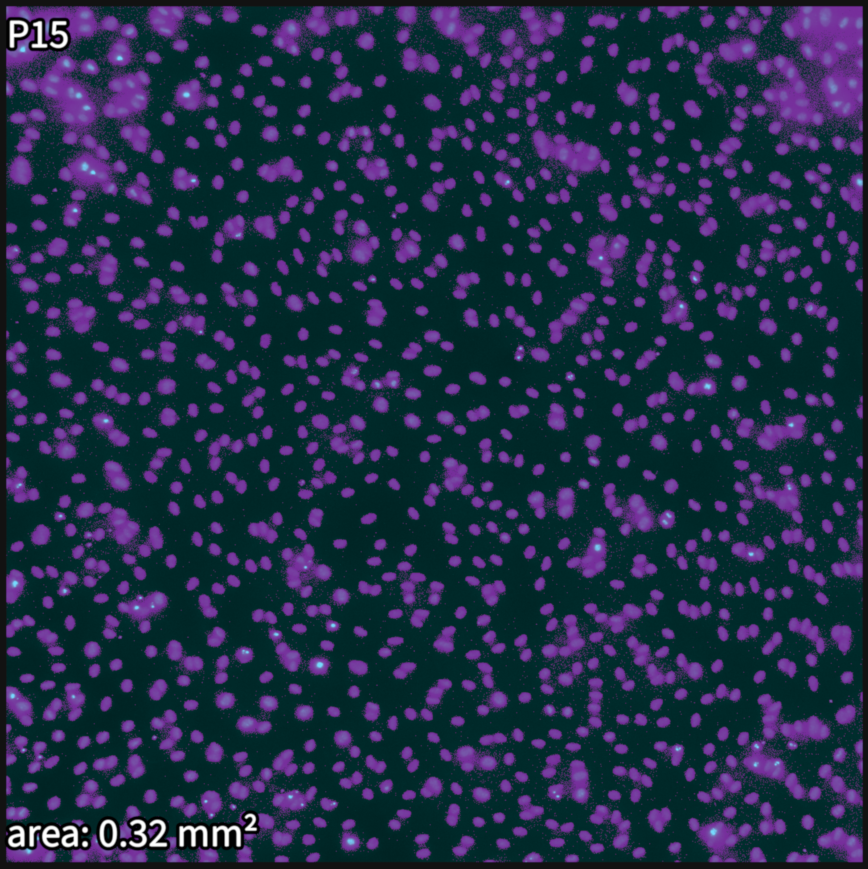
Masks (purple) overlaying the area defined by the lower and upper bounds of the threshold in a selected fluorescence channel, with the area indicated at the bottom left corner.
Step |
Function |
|---|---|
1 |
Open an acquired dataset in the MCAM™ Viewersoftware. |
2 |
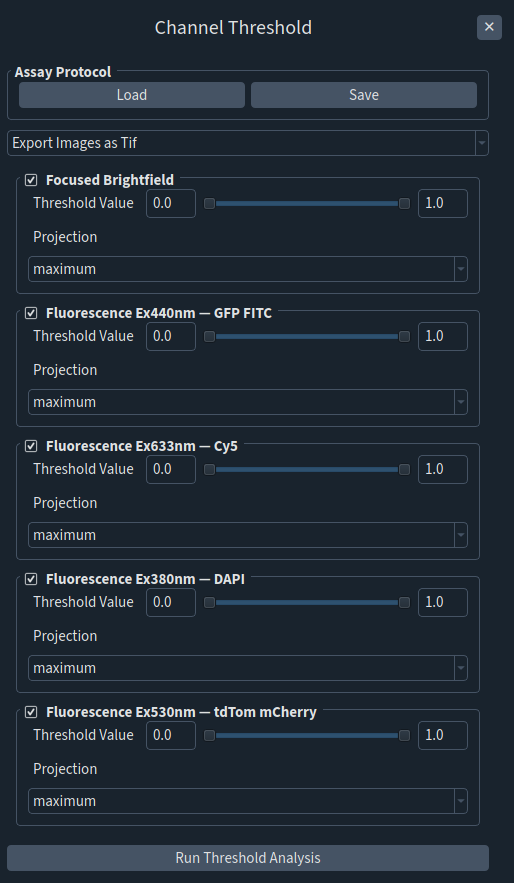
Navigate to Assays > Channel Threshold. A panel will open on the right. |
3 |
All channels are selected to be analyzed by default. Deselect the channels that don’t need to be analyzed by unchecking the box of the unrelated channels. |
4 |
Define the upper and lower bounds of the threshold by moving the sliders or by entering values. |
5 |
(Optional) Select the intended type of projection if the dataset loaded contains images with multiple Z frames. |
6 |
Click “Run Threshold Analysis” to run the analysis. |
7 |
The results are saved in a folder named “threshold_analysis_results” in the parent folder of the analyzed dataset. A csv file is generated summarizing the quantification of area(s) between upper and lower bound threshold fluorescence values for each channel selected on a per field of view basis. A subfolder is created where images with masks indicating the areas calculated are included. |