

Cell Counting Analysis
The cell counting analysis allows users to count the numbers of bright cells on a dark background, for example, the number of the DAPI-nuclear stained cells. It counts the number of cells within each field of view and outputs a csv of the number of cells in each field of view. This analysis is compatible with 96-, 384-, and 1536-well plates. Cell counting works best for binary datasets with high contrast.
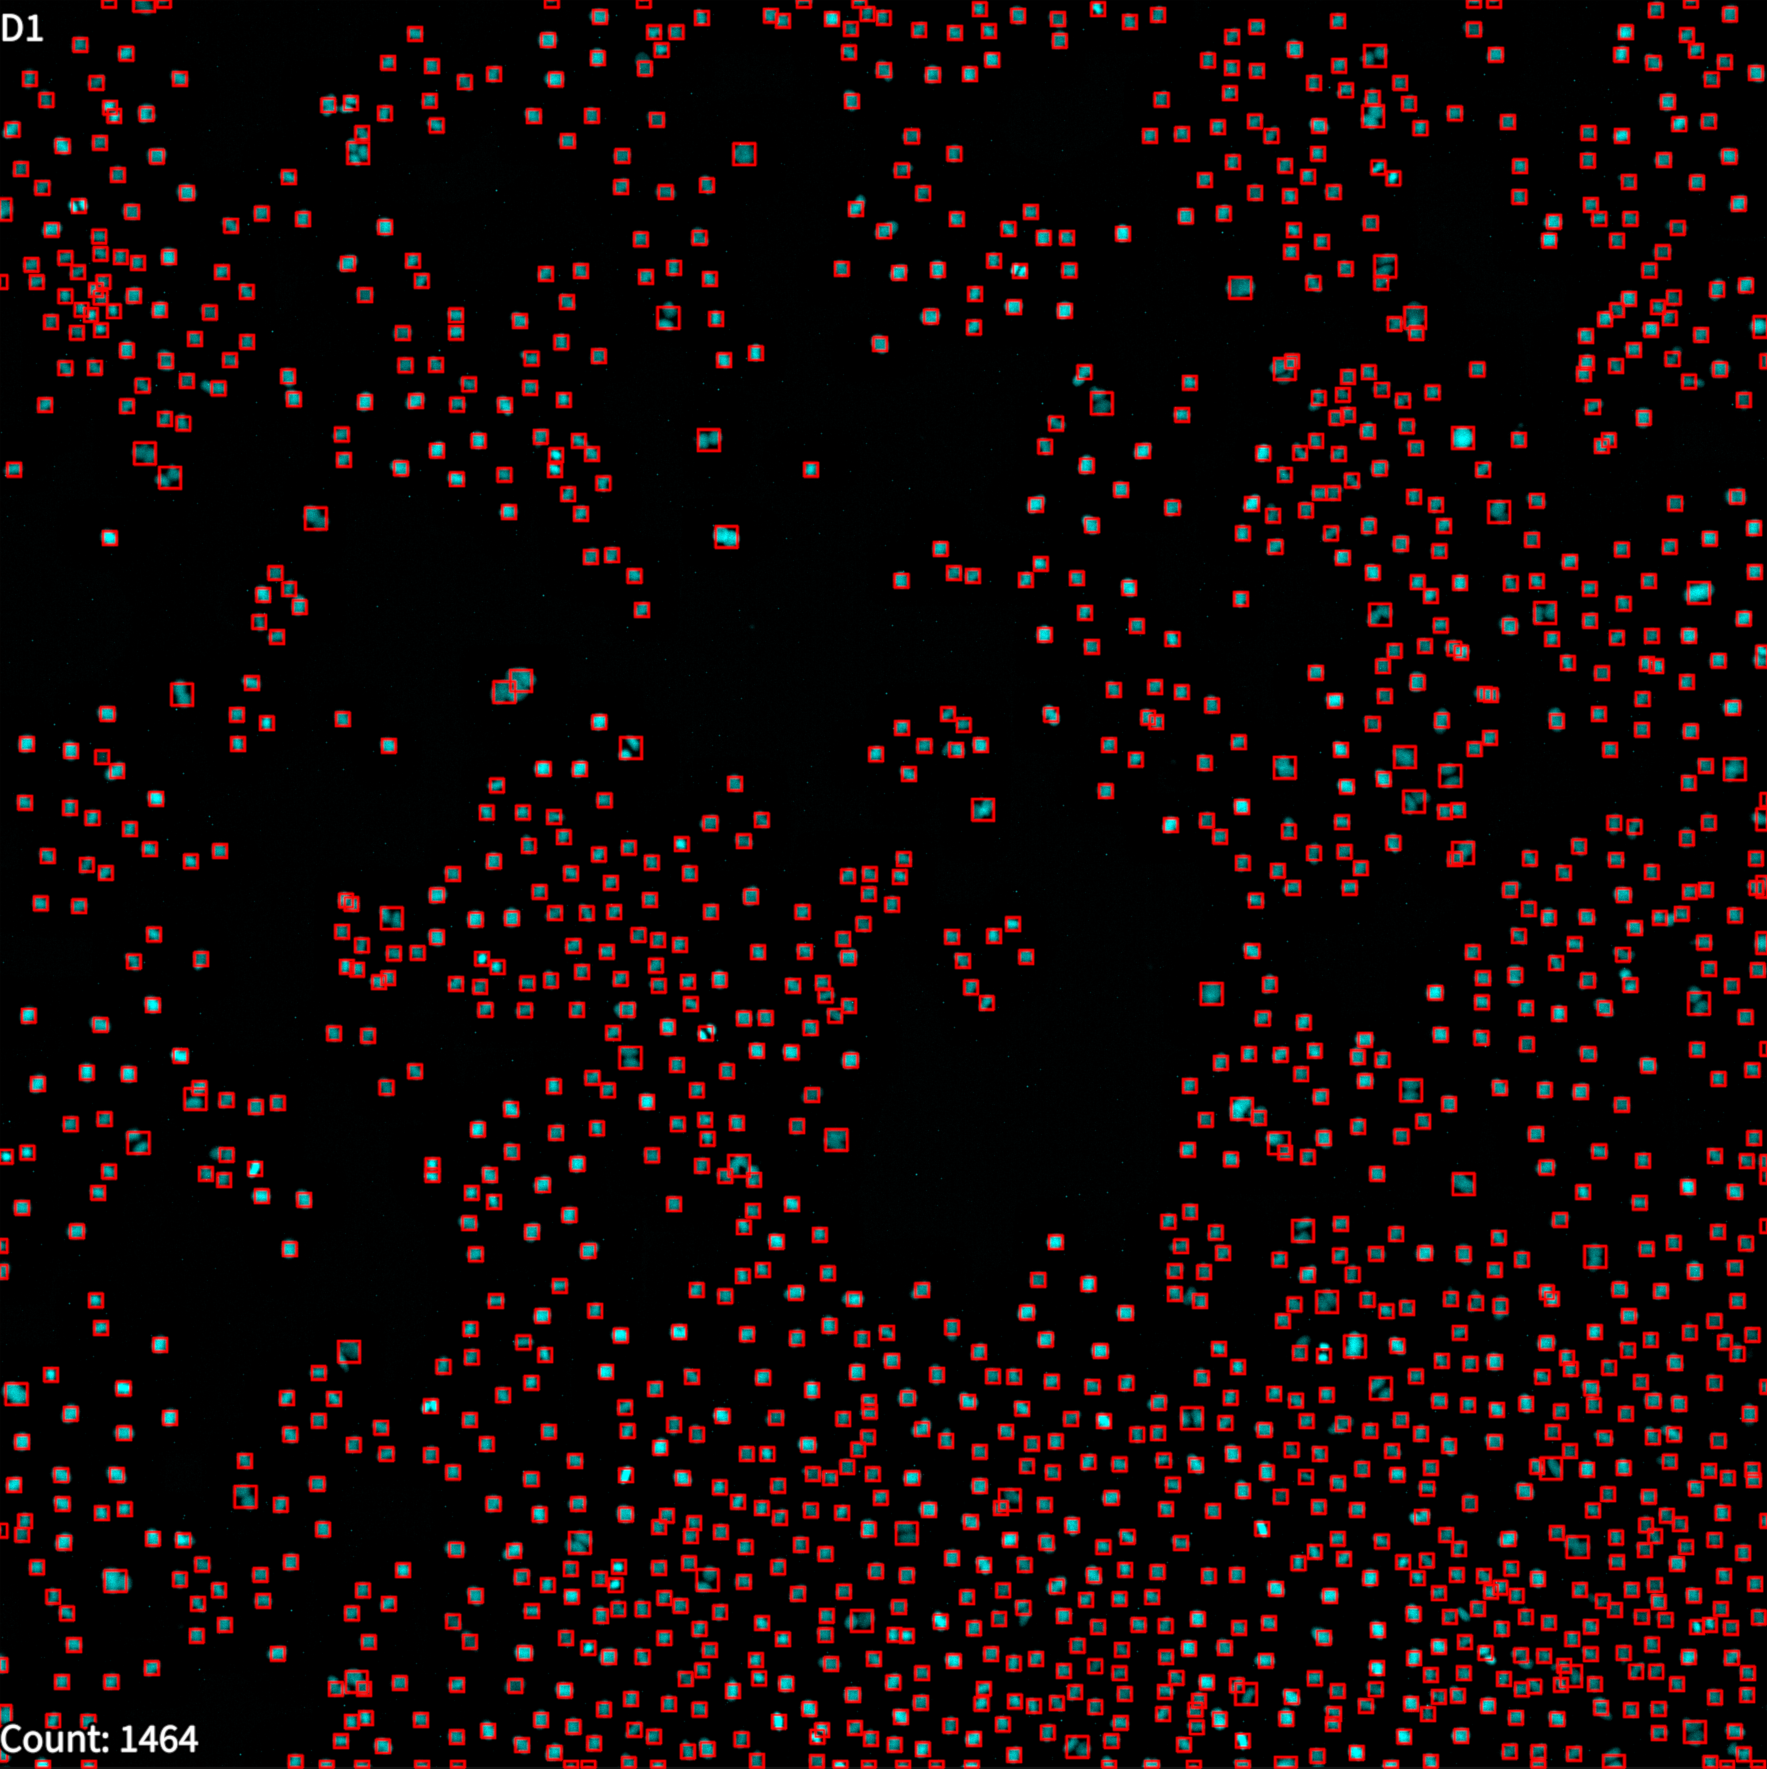
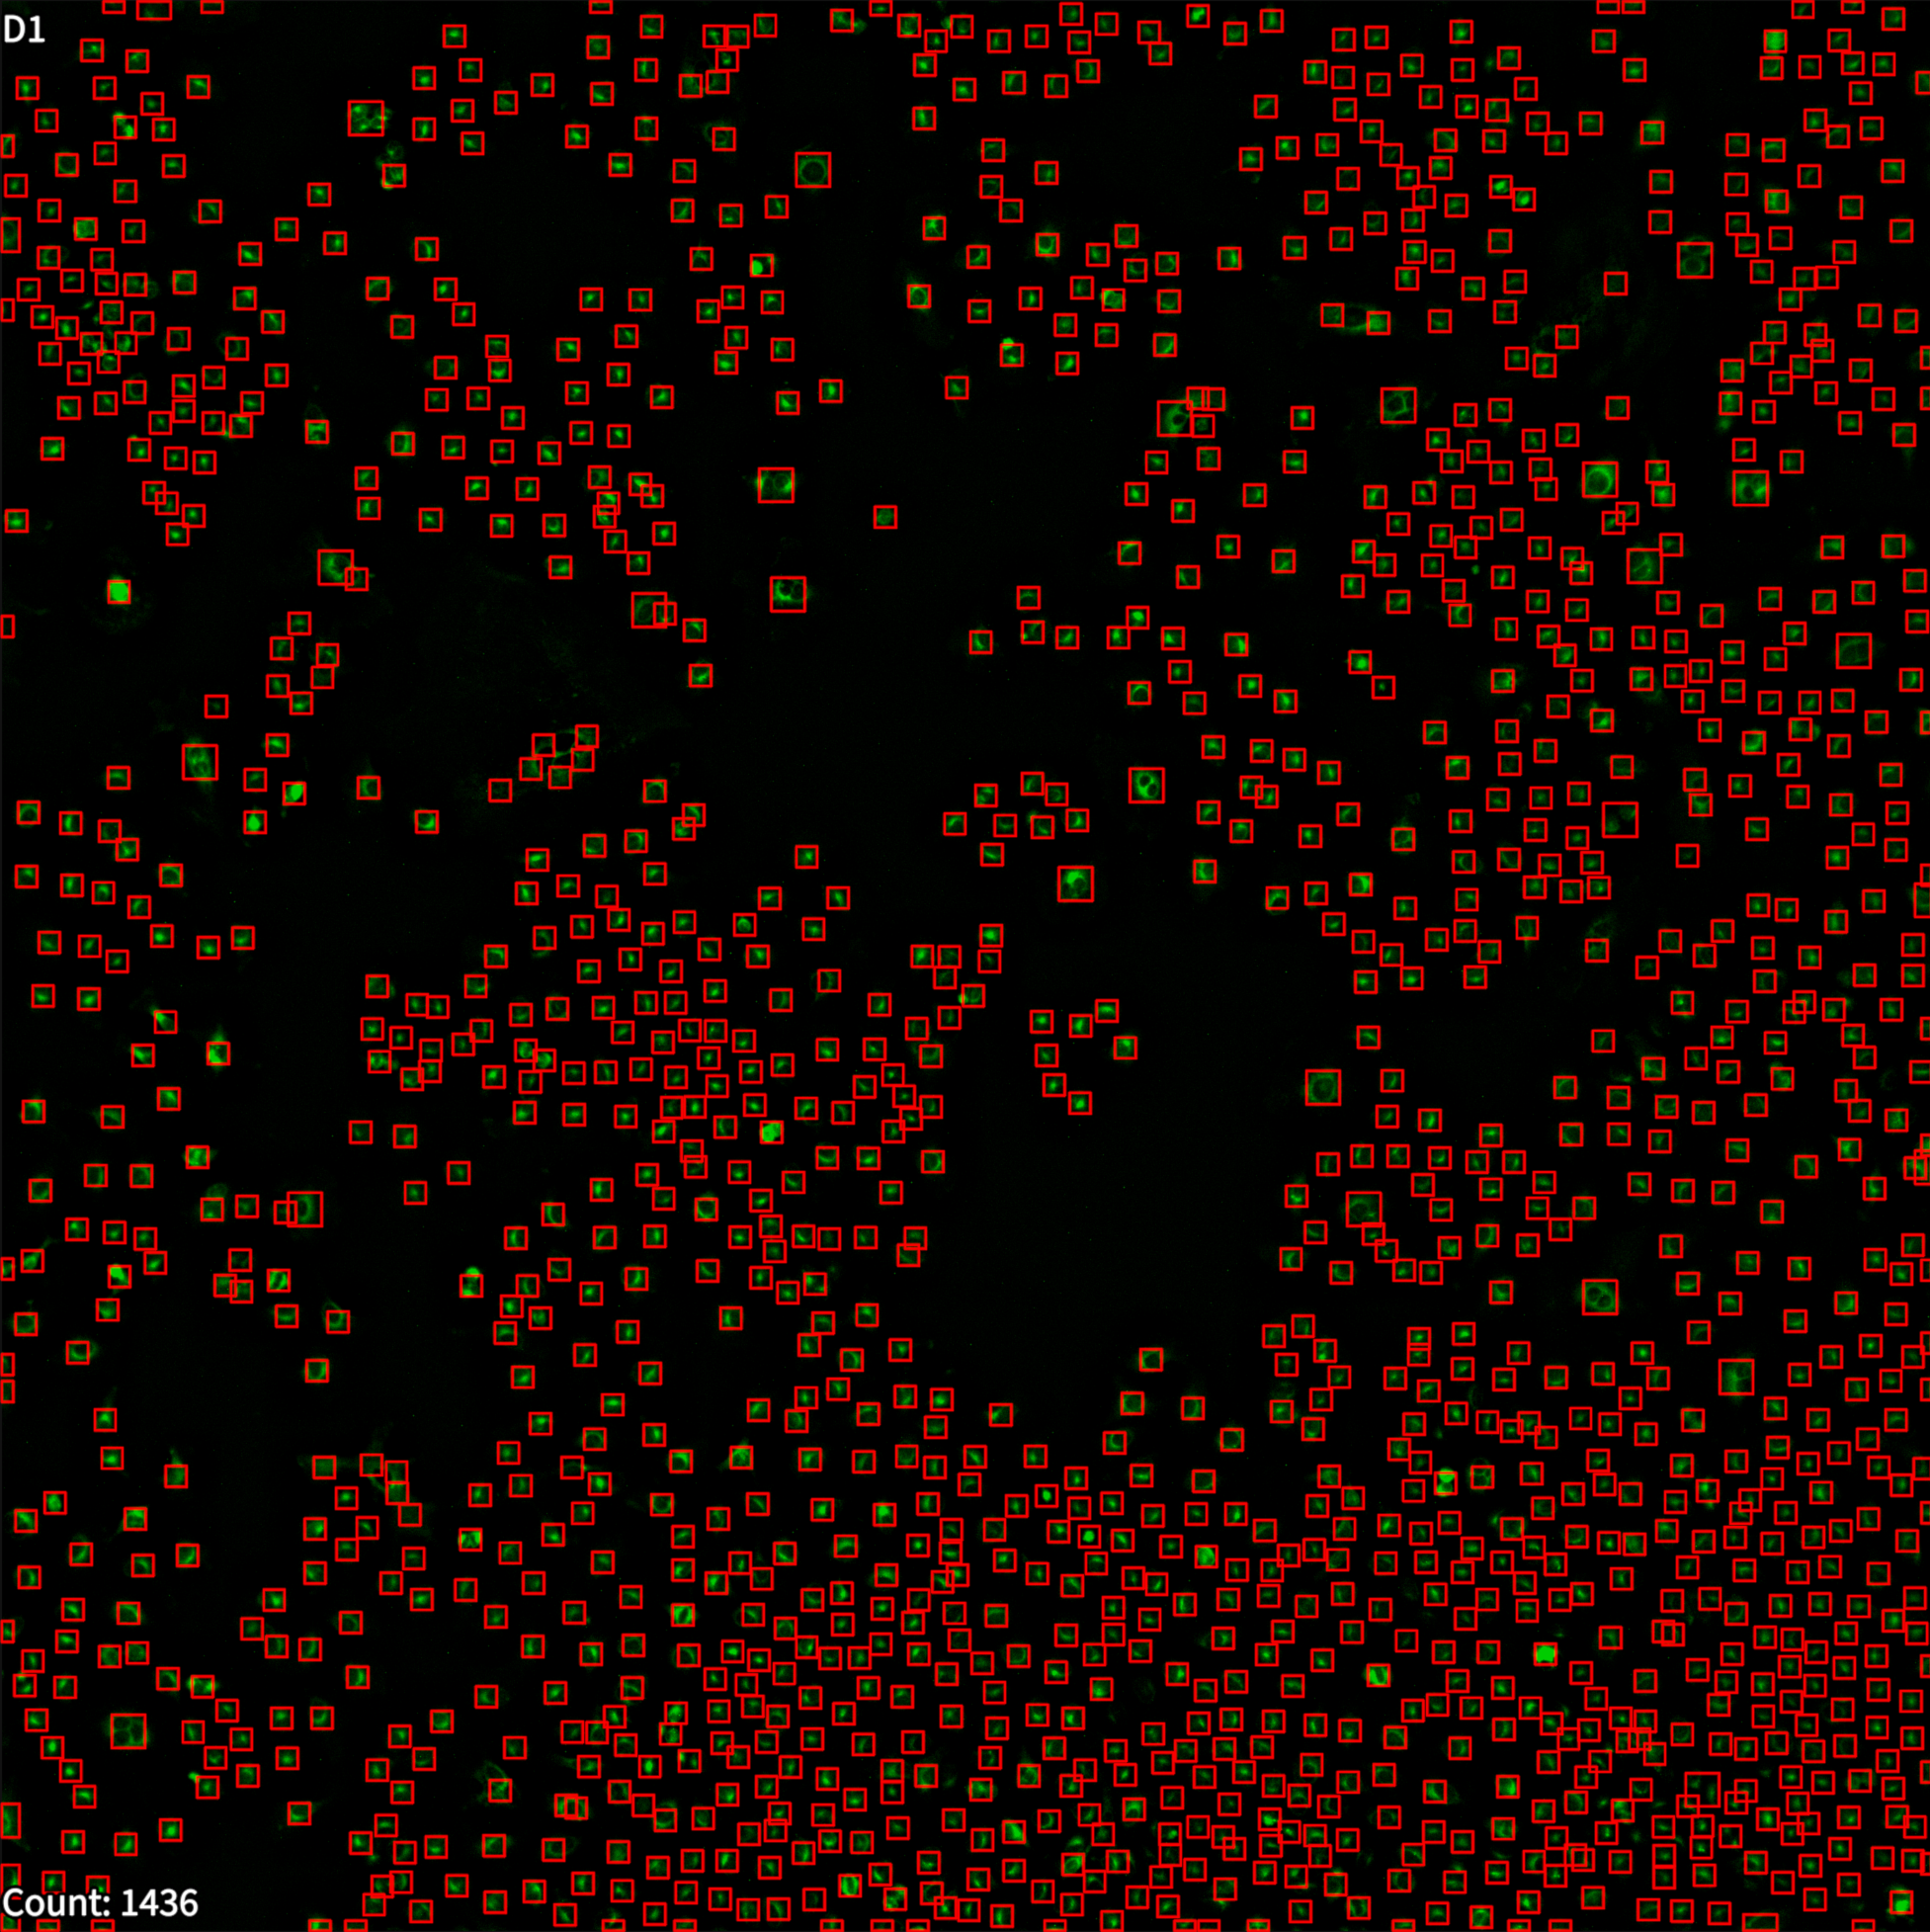
Counting DAPI and GFP Cells
Step |
Function |
|---|---|
1 |
Load the well plate onto the Vireo. |
2 |
Capture an XYZC stack at 4x or 10x magnification, optimally in the DAPI - 380nm fluorescence channel and Laplacian projection. |
3 |
Open the acquired dataset in the MCAM Viewersoftware. |
4 |
Go to Assays > Cell Counting. A panel will open on the right. |
5 |
Input minimum and maximum cell radii in um (you can measure cell radius by using the circle tool under “Tools”). |
6 |
Click “Detect Cells” to run the analysis. |
7 |
Analysis results are displayed on the screen and saved in a folder named “cell_count_analysis_results” in the dataset’s folder. Two files are generated, “analysis_metadata.nc” file containing the analysis results and a csv file summarizing the cell count on a per well basis. |