

Zebrafish Morphology and Segmentation - BrightField
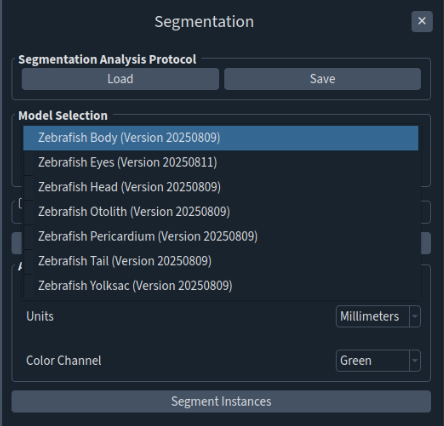
The Ramona MCAM supports fully automated segmentation of zebrafish from both single-frame and stack datasets. Users can choose from seven segmentation models—body, eyes, otolith, pericardium, tail, and yolk sac—or apply all models simultaneously. The analysis produces a CSV file containing the measured area for each selected model. For additional details on the underlying mechanics of the segmentation workflow, please refer to the MCAM User Manual.
Step |
Function |
|---|---|
1 |
Acquire an XYZ-stack dataset using the XYZ-stack acquisition mode described above. |
2 |
Open the dataset in the MCAM Viewer by double clicking on the metadata.nc file or drag-and-dropping it into the viewer. |
3 |
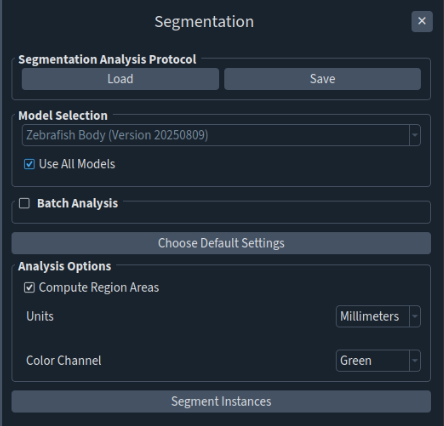
Go to Analysis > Zebrafish > Segmentation to open the segmentation panel. |
4 |
Select a segmentation model specific to the current segmentation task from the model selection menu. |
5 |
If you would like to compute region areas, check “Compute Region Areas”. |
6 |
Select an SI unit for exported values. “Millimeters” is selected by default. |
7 |
Click “Segment Instances” to run the analysis. |
8 |
Results are output to a new directory with the same name as the analyzed dataset with “_segmentation_results” appended. |
9 |
Segmentation visualizations are displayed in the MCAM Viewer. |