

Confluence Analysis - 10x Magnification
The confluence analysis allows you to assess cell growth of 2D adherent cells at 10x magnification in 4 x 4 overlapping images per well measuring the area of cell coverage and outputs a csv of the confluence for each well. This analysis is optimized for 96-well plates.
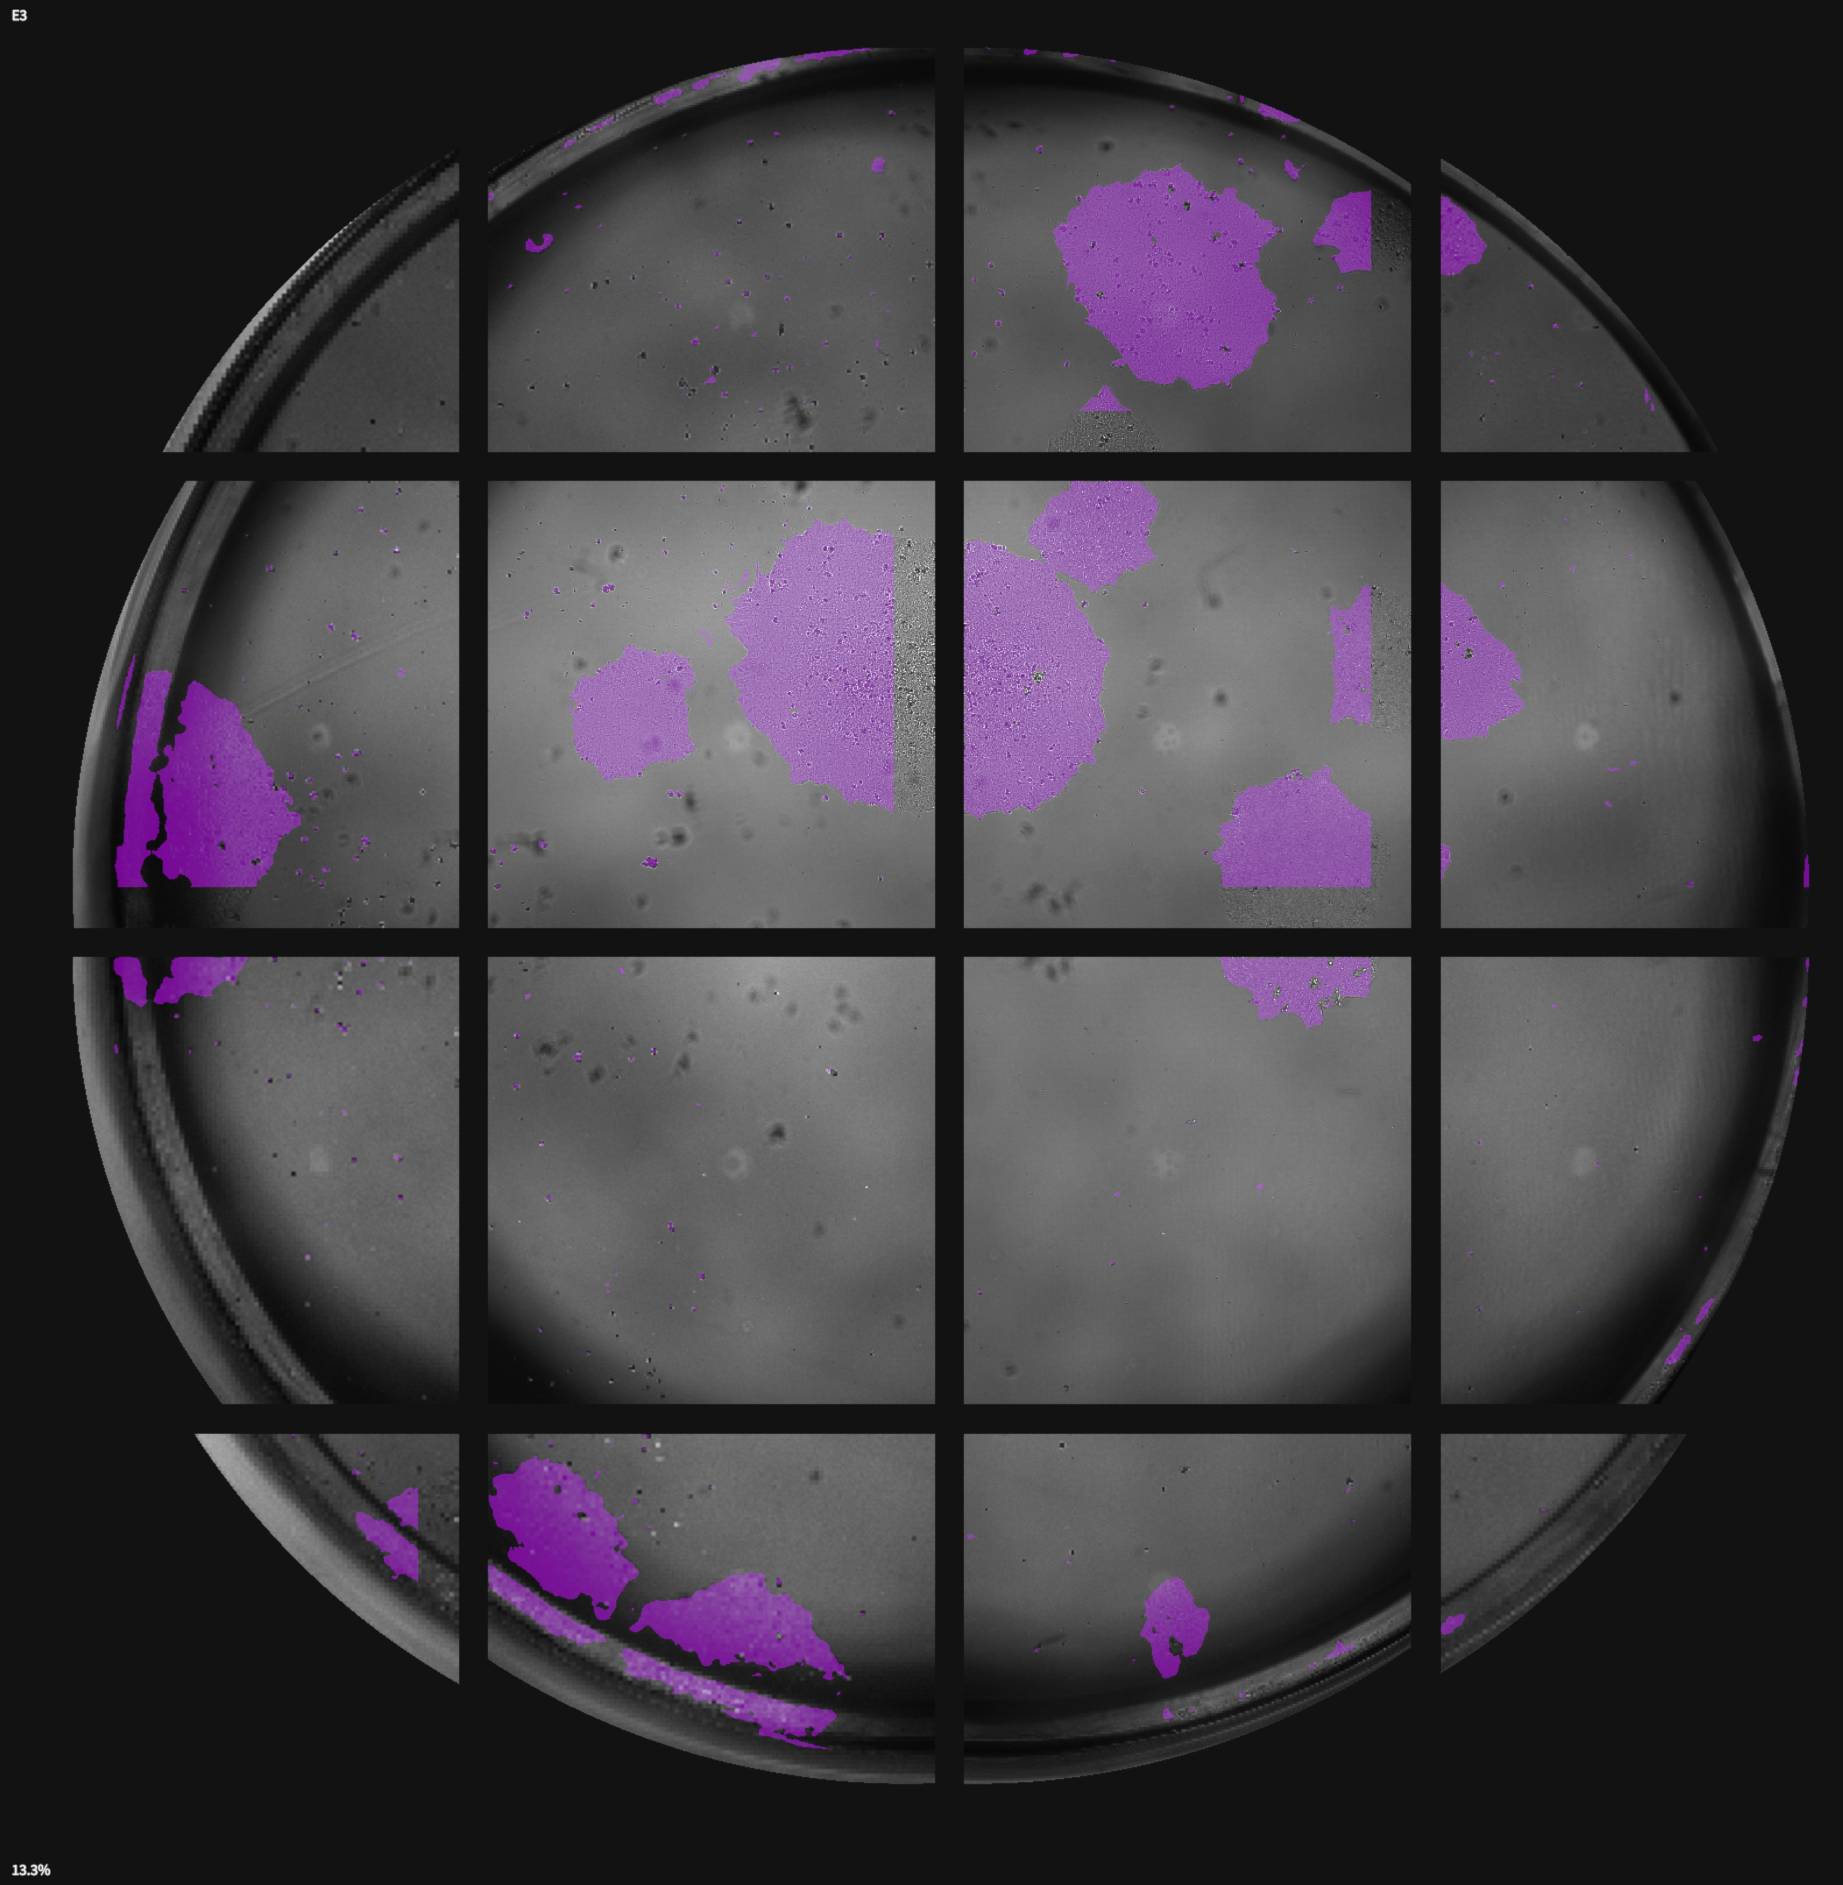
Unstitched 4x4 image scan of a 96-well plate well showing overlap regions that are excluded.
Step |
Function |
|---|---|
1 |
Load your 96-well plate onto the MCAM. |
2 |
Acquire an XYZC stack at 10x magnification with a 4x4 well plate scan withfocused brightfield illumination and Laplacian projection. Please see the workflow guide for “Full Wellplate Scan” for more information on acquisition. |
3 |
Open the acquired dataset in the MCAM™ Viewersoftware. |
4 |
Go to Assay > Confluence. A panel will open on the right. |
5 |
Select a well alignment file specific to the well plate in use. Please see “Create a Well Alignment File” for more information. |
6 |
Click “Compute Confluence” to run the analysis. |
7 |
Analysis results are displayed on the screen and saved in a folder named “confluence_results” in the parent folder of the analyzed dataset. Two files are generated, “analysis_metadata.nc” file containing the analysis results and a csv file summarizing the quantification of confluence on a per well basis. |
8 |
Interpretation: Regions outside of the well alignment radius are excluded. Regions in one half of overlapping images are excluded. The bottom and right overlap margins are excluded selectively. The percent confluent is displayed in the bottom left corner of the screen. |