10. MCAM Assays
These are the following assays available to the MCAM.
Activity Metric
The Activity Metric is defined by the following formula:
where \(P_{i} \left(x,y \right)\) is the pixel value at location \(\left(x,y \right)\) in frame \(i\) and \(P_{i-1} \left(x,y \right)\) is the pixel value at the same location (x,y) for the prior frame. The difference between the two pixel values is normalized by the average of the two pixel values and compared to a threshold \(T\). If the normalized difference is greater than \(T\) then the pixel is considered active. The difference between the two pixel values is also compared to \(D\), the difference threshold. If the difference between the two pixel values is greater than \(D\) than the pixel is considered active. A pixel must exceed both the \(T\) and the \(D\) thresholds to be counted as active. Activity for frame \(i\) is a count of all the active pixels between frame \(i\) and frame \(i-1\).
With this formula the Activity Metric for the first frame is always 0. The activity metric is calculate for each series of frames in th dataset array individually, resulting in an array of of values of shape (number of frames, number of images in array).
Analysis Activity Metric Assay
|
||
properties |
||
|
pixel_threshold |
|
Threshold to be applied to the absolute difference of pixels between frames relative to the average of the pixels. Pixels with a difference greater than this threshold are considered to be active as long as they are also above the difference_threshold. Decreasing this value makes the analysis more sensitive to pixel changes, especially in dark regions. Increasing this value makes the analysis less sensitive to pixel changes. Maximum value is 1 and minimum value is 0. |
||
type |
float |
|
default |
0.3 |
|
|
difference_threshold |
|
Threshold to be applied to the absolute difference of pixels between frames. Pixels with a difference greater than this threshold are considered to be active as long as they are also above the pixel_threshold. Increasing this value makes the analysis less sensitive to pixel changes, especially in dark regions. Maximum value is 255 and minimum value is 0. |
||
type |
int |
|
default |
0 |
|
|
mask_array |
|
Mask to be applied to the image before calculating the activity metric. If None, no mask is applied. This array must match the shape of the image array. The mask is applied by multiplying the mask array by the image array. The mask array should be a boolean array where True values indicate pixels to be included in the calculation and False values indicate pixels to be excluded from the calculation. |
||
type |
Optional |
|
default |
None |
|
|
rgb_channel |
|
RGB channel to use for calculating the activity metric. Only used if the given dataset is RGB or Bayer. Accepted values are 0, 1, and 2. |
||
type |
Optional |
|
default |
0 |
|
|
include_csv_header |
|
If true, a header is added to the csv file. |
||
type |
bool |
|
default |
True |
|
|
activity_metric_composite |
|
If true, a composite image of the activity metric is saved. This will generate a composite image of all the wells in the dataset with the activity metric of each well overlaid on the well. |
||
type |
bool |
|
default |
True |
|
|
activity_metric_plot |
|
If true, a plot of the activity metric is saved. This will generate a single plot for each well that shows the activity metric for each time point. |
||
type |
bool |
|
default |
True |
|
|
cumulative_activity_metric_plot |
|
If true, a plot of the cumulative activity metric is saved. This will generate a single plot for each well that sums the activity metric from the first time point up to and including the current time point. |
||
type |
bool |
|
default |
True |
|
|
time_bin |
|
The number of seconds per time bin by which exported activity data is binned. An entry of ‘None’ suggests no binning. |
||
type |
Optional |
|
default |
None |
|
Zebrafish Tail Coil Assay
|
||
properties |
||
|
well_keypoints |
|
Well Plate Keypoints. If provided the acquired images will be extracted and interpreted as images of a well plate on a per wellbasis. |
||
type |
WellPlateKeypointState |
|
default |
None |
|
|
start_delay |
|
Amount of time in seconds to wait before beginning assay. |
||
type |
float |
|
default |
0.0 |
|
|
frame_rate |
|
Frame rate the assay will acquire video at. |
||
type |
float |
|
default |
16 |
|
|
acquisition_duration |
|
Time in seconds that the assay will acquire video for |
||
type |
float |
|
default |
1 |
|
|
pixel_threshold |
|
Threshold to be applied to the absolute difference of pixels between frames relative to the average of the pixels. Pixels with a difference greater than this threshold are considered to be active as long as they are also above the difference_threshold. Decreasing this value makes the analysis more sensitive to pixel changes, especially in dark regions. Increasing this value makes the analysis less sensitive to pixel changes. Maximum value is 1 and minimum value is 0. |
||
type |
float |
|
default |
0.1 |
|
|
difference_threshold |
|
Threshold to be applied to the absolute difference of pixels between frames. Pixels with a difference greater than this threshold are considered to be active as long as they are also above the pixel_threshold. Increasing this value makes the analysis less sensitive to pixel changes, especially in dark regions. Maximum value is 255 and minimum value is 0. |
||
type |
int |
|
default |
20 |
|
Embryonic Photomotor Response (EPMR)
The Embryonic Photomotor Response (EPMR) assay quantifies larval motion using the Activity Metric described above.
Zebrafish Embryonic Photomotor Response Assay
|
||
properties |
||
|
well_keypoints |
|
Well Plate Keypoints. If provided the acquired images will be extracted and interpreted as images of a well plate on a per wellbasis. |
||
type |
WellPlateKeypointState |
|
default |
None |
|
|
background_period |
|
Amount of time in seconds before the first light flash. |
||
type |
float |
|
default |
30 |
|
|
first_light_flash_duration |
|
Amount of time in seconds for the first light flash to be on. |
||
type |
float |
|
default |
1 |
|
|
first_light_flash_lux |
|
The brightness of the first light flash. |
||
type |
float |
|
default |
6000 |
|
|
excitatory_period |
|
Amount of time in seconds between the first and second light flashes. |
||
type |
float |
|
default |
9 |
|
|
second_light_flash_duration |
|
Amount of time in seconds for the second light flash to be on. |
||
type |
float |
|
default |
1 |
|
|
second_light_flash_lux |
|
The brightness of the second light flash. |
||
type |
float |
|
default |
6000 |
|
|
refactory_period |
|
Amount of time in seconds after the second light flash. |
||
type |
float |
|
default |
9 |
|
|
start_delay |
|
Amount of time in seconds to wait before beginning assay. |
||
type |
float |
|
default |
0.0 |
|
|
frame_rate |
|
Frame rate the assay will acquire video at. |
||
type |
float |
|
default |
16 |
|
|
pixel_threshold |
|
Threshold to be applied to the absolute difference of pixels between frames relative to the average of the pixels. Pixels with a difference greater than this threshold are considered to be active as long as they are also above the difference_threshold. Decreasing this value makes the analysis more sensitive to pixel changes, especially in dark regions. Increasing this value makes the analysis less sensitive to pixel changes. Maximum value is 1 and minimum value is 0. |
||
type |
float |
|
default |
0.1 |
|
|
difference_threshold |
|
Threshold to be applied to the absolute difference of pixels between frames. Pixels with a difference greater than this threshold are considered to be active as long as they are also above the pixel_threshold. Increasing this value makes the analysis less sensitive to pixel changes, especially in dark regions. Maximum value is 255 and minimum value is 0. |
||
type |
int |
|
default |
20 |
|
|
flash_illumination_mode |
|
Controls what illumination mode should be used to create the flash. By using a fluorescence illumination mode the flash can be raised up to 50000 lux, while the transmission and reflection boards only reach 6000 lux. |
||
type |
str |
|
default |
transmission_visible_pwm_fullarray |
|
Data Handling and Reanalysis
When you run the EPMR assay, the EPMR analysis always runs on the raw,
uncompressed data as it is captured. To reanalyze a dataset later, you compress
it and run the activity-metric analysis on the compressed .mp4. How you
choose to save the source data does not affect this — base that decision on your
own needs, whether that is higher-quality imagery or smaller data storage.
What happens while the assay runs. The EPMR analysis runs on the captured
data and writes the original results.csv. The raw mcam_dataset.nc is an
optional lossless copy, and compressing to dataset.mp4 is what makes later
reanalysis possible.
        flowchart LR
    C[Captured data]
    C --> E[EPMR analysis]
    E --> R1["results.csv<br/><small>Original results</small>"]
    C --> NC["mcam_dataset.nc<br/><small>Raw · lossless · optional</small>"]
    C --> K[Compress]
    K --> V["dataset.mp4<br/><small>Compressed · lossy</small>"]

    classDef green stroke:#2da44e,stroke-width:2px;
    classDef amber stroke:#bf8700,stroke-width:2px;
    classDef blue stroke:#0969da,stroke-width:2px;
    class R1 green;
    class NC blue;
    class V amber;
Re-running activity analysis later reads the saved dataset.mp4 and runs the
activity analysis on it to produce a fresh results.csv.
        flowchart LR
    V["dataset.mp4"] --> RD[Read] --> AA[Activity analysis] --> R2["results.csv<br/><small>Will differ from original</small>"]

    classDef amber stroke:#bf8700,stroke-width:2px;
    class V,R2 amber;
Warning
Reanalysis will not reproduce the original results.
MP4 compression is lossy — it alters the pixel values the activity analysis relies on. Reanalyzing the compressed video therefore produces different numbers than the original EPMR analysis of the uncompressed data. See Image and Video Storage Formats for how compression affects pixel data.
Tip
Recommended workflow
If you expect to reanalyze, treat the compressed-data analysis as your
reference (“true”) results — it is the only output you can reproduce later
from the saved .mp4. When the drive has room, also archive the raw
.nc as a higher-quality copy — you can always recompress it later if
needed. Reporting from the compressed analysis keeps your baseline and any
future reanalysis consistent.
Zebrafish Tracking
Zebrafish tracking uses a pose detection neural network to infer 8 key points on each fish and using the resulting cartesian coordinates determine various kinematic parameters such as distance traveled, speed, tail bend angle, and swim heading.
The zebrafish tracking workflow consists of two parts: acquisition and analysis. During acquisition users can flexibly configure recording duration, frame rate, and integrated stimuli (flash, vibration, and tap). The analysis portion automatically detects the well plate in use (24, 48, 96 well plate) and users may select which output metrics they would like to receive.
Zebrafish Assay
Parameters provided to the Zebrafish assay. |
||
properties |
||
|
final_mcam_state |
|
State of MCAM after acquisition. If specified, the assay will call MCAM.set_state with the parameters specified here. If None or undefined, the state at the end of the acquisition is defined by the assay. |
||
type |
MCAMState |
|
default |
None |
|
|
well_keypoints |
|
Well Plate Keypoints. If provided the acquired images will be extracted and interpreted as images of a well plate on a per wellbasis. |
||
type |
WellPlateKeypointState |
|
default |
None |
|
|
background_color |
|
Background color for the transmission illumination board. If None, the background color is disabled. |
||
type |
Optional |
|
default |
None |
|
|
background_color_ratio |
|
Background color ratio for the transmission illumination board. If None, the background color is disabled. |
||
type |
Optional |
|
default |
None |
|
|
background_lux |
|
Background illumination level in lux. If None, the background illumination is disabled. |
||
type |
Optional |
|
default |
None |
|
|
background_retain_after_assay |
|
If True, the background illumination will be left on after the assay is complete. |
||
type |
Optional |
|
default |
False |
|
|
stimuli |
|
List of stimuli |
||
type |
list |
|
default |
None |
|
|
start_delay |
|
Amount of time in seconds to wait before beginning assay. |
||
type |
float |
|
default |
0.0 |
|
|
frame_rate |
|
Frame rate the assay will acquire video at. |
||
type |
float |
|
default |
10 |
|
|
acquisition_duration |
|
Time in seconds that the assay will acquire video for |
||
type |
float |
|
default |
1 |
|
|
selection_type |
|
Selection of sensors. Options include ‘full_array’ and ‘subset’ |
||
type |
Optional |
|
default |
full_array |
|
|
selection_slice |
|
A tuple of 2 slice objects to describe the desired cameras |
||
type |
Any |
|
default |
None |
|
Tracking Analysis Assay
Parameters provided to the tracking analysis. |
||
properties |
||
|
reanalyze_previous_tracking |
|
If True and a tracking_metadata.nc file from a previous analysis is found, inference will be skipped and only analysis computations will be executed. |
||
type |
bool |
|
default |
False |
|
|
apply_circle_mask |
|
If True, a circle mask will be applied to each well of exported well plate images and videos. If False, it is assumed the well plate has square wells and no well mask is applied. |
||
type |
bool |
|
default |
True |
|
|
chosen_model |
|
The model name of the tracking model. |
||
type |
str |
|
default |
None |
|
|
export_csvs |
|
If True, all raw tracking data and computed metrics will be exported as csv files. |
||
type |
bool |
|
default |
True |
|
|
include_csv_header |
|
If True, headers will be included in tracking data csv files. |
||
type |
bool |
|
default |
True |
|
|
plot_tracks |
|
If True, tracks will be plotted on images of each well and exported as well plate composite image. |
||
type |
bool |
|
default |
True |
|
|
plot_tracks_with_speed |
|
If True, colors of plotted tracks will represent speed with the color gradient ranging from blue (slower) to red (faster) and green representing speeds over 50 mm/sec. |
||
type |
bool |
|
default |
True |
|
|
eye_analysis |
|
If True, eye analysis will be computed. Please note that this analysis is computationally intensive and thus adds significant analysis time. Additionally, bin1 or bin2 data are required. |
||
type |
bool |
|
default |
False |
|
|
save_tracking_metadata |
|
If True, tracking metadata will be saved as a netcdf .nc file. This is recommended as it contains all tracking data in one file and is amenable to future programmatic analysis. |
||
type |
bool |
|
default |
True |
|
|
label_video |
|
If True, a labeled video with tracking overlays will be exported. Further options include labeling of key points, skeleton, tail vectors, and eye angles. |
||
type |
bool |
|
default |
True |
|
|
video_labeling_parameters |
|
Dictionary of video labeling parameters including boolean values for label_keypoints, label_skeleton, label_tail, label_heading, and label_eyes. |
||
type |
dict |
|
default |
OrderedDict() |
|
|
anomalies |
|
If True, anomaly detection filtering will be applied to tracking data including well radius, speed, and center of mass filters. |
||
type |
bool |
|
default |
True |
|
|
denoise |
|
If True, wavelet denoising will by applied to tracking data during calculation of distance traveled. |
||
type |
bool |
|
default |
True |
|
|
time_bin |
|
The number of seconds per time bin by which exported tracking data is binned. An entry of ‘None’ suggests no binning. |
||
type |
Optional |
|
default |
None |
|
|
visualize_distance_traveled |
|
If True, distance traveled will be plotted according to requested grouping. |
||
type |
bool |
|
default |
True |
|
|
plot_stimuli |
|
If True and distance traveled plots are exported, stiumli present in a dataset will be visualized as a separate axis below each plot. |
||
type |
bool |
|
default |
True |
|
|
plot_parameters |
|
Dictionary of plot configuration parameters including cumulative vs. instantaneous, grouping, colormap, one plot, and save format. |
||
type |
dict |
|
default |
OrderedDict() |
|
|
animal_behavior_enabled |
|
If True, run animal behavior analysis after tracking completes (tracking analysis panel). |
||
type |
bool |
|
default |
False |
|
|
animal_behavior_chosen_model |
|
Animal behavior model registry key. |
||
type |
Optional |
|
default |
None |
|
|
animal_behavior_plot_behavior |
|
If True, motion metrics and ethograms are generated for each animal (image file for each well). |
||
type |
bool |
|
default |
True |
|
|
animal_behavior_plot_summary |
|
If True, a well plate summary of behaviors is generated (array of behavior pie charts in an image file). |
||
type |
bool |
|
default |
True |
|
|
animal_behavior_save_format |
|
Save format for behavior plots: ‘.png’ or ‘.svg’. |
||
type |
str |
|
default |
.png |
|
Zebrafish Flash Stimuli Calibration
The Zebrafish Assay panel provides the user with the option to configure a video recording of Zebrafish (Danio rerio) larvae at a user selectable frame rate for a controlled duration of time.
One key stimuli that can be delivered to the zebrafish is a controlled flash of light. The zebrafish assay panel as of owl version 0.19.23 provides the ability to customize the color of the flash delivered to the zebrafish.
The discussion below provides a brief overview of how one can tune the parameters to obtain a repeatable, cablibrated and reproducible assay.
To complete the calibration process, you must have access to a lux meter. Inexepensive digital lux meters are available on Amazon and other online retailers and can be obtained for less than $50.
To start the calibration process, set the illumination mode to be “Transmission
IR850” at 50% brightness. This ensures that the flash stimuli’s brightness can
be maximized. To calibrate the system, we will use the Background
Illumination controls to dynamically adjust adjust the settings before
recording them as stimuli.
Place the detector of the lux meter face down on the surface of the diffuser in the center.
With only the IR lights on, the lux meter should read a lux value less than 5 lux.
Set the Lux meter’s range to be able to display values in the thousands. Typically this is denoted by a little
100xmultiplier on the diplay of the lux meter.Select the color of the flash you desire. Otions include
White,Red,Green,BlueandCustom. As a starting point, set the lux to 1000.Note that the hue of
Whiteflash may appear different than what you expect. TheCustomoption allows you control the hue by adjusting the fraction of the red green and blue LED values. Adjust the values of the red, green, and blue intensity as desired.Ajust the LUX until the desired reading on the LUX meter is acheived. Note that the measurement on the lux meter is dependent on the distance between the lux meter and the diffuser. This is true for any diffuse light source.
Repeat steps 5 and 6 until the desired reading is acheived.
The figure below was generated by measuring a few different values of with the setup described above on a typical MCAM at the Ramona Optics facilities.
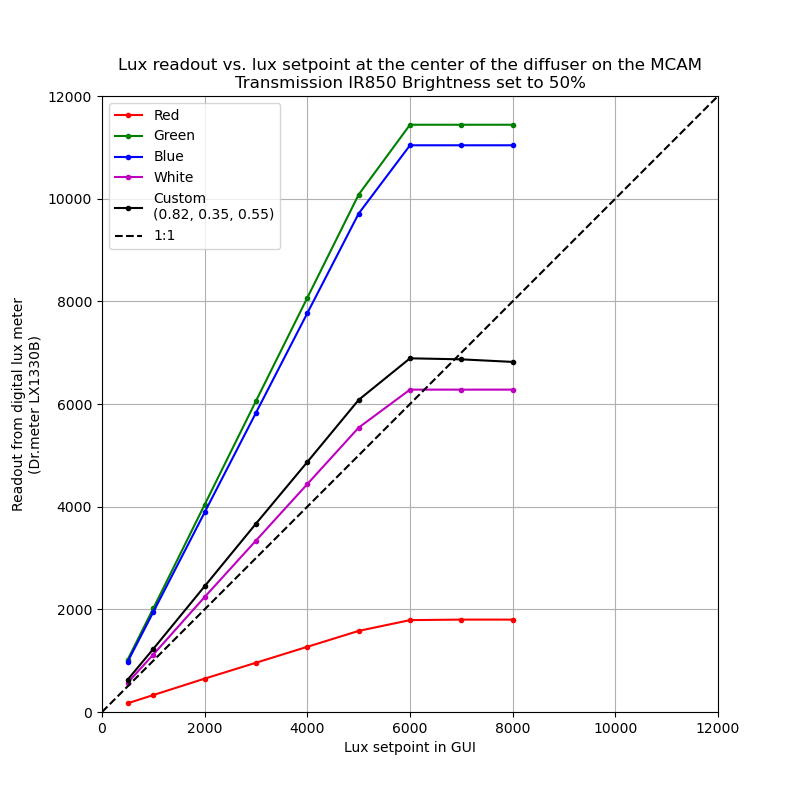
As shown in the figure above, the lux setpoint in the entry box was calibrated
to close to a 1:1 relationship for the measured lux in the White color
dropdown. However users may change to adjust the hue of the flash by selecting
the Custom option (the default values are those of the white setpoint) and
adjusting them ever so slightly.
Once you record your settings, they may be used in the flash stimuli toolbox to programatically change the values of the illumination throughout the acquisition.
Segmentation
Multiple segmentation workflows exist, each focused on different aspects of different organisms. Please see the different workflow sections below.
Zebrafish Segmentation
MCAM Zebrafish segmentation is based on a 2D-UNet which has become a mainstay in biomedical image analysis. Multiple zebrafish segmentation models are actively in use including brightfield and fluorescence modalities. Once segmentation masks have been inferred for each fish, further analysis can be performed within these regions such as area measurement, blob counting (to quantify cell counts for example), and bulk fluorescence intensity quantification.
Segmentation Analysis Assay
Parameters provided to the segmentation analysis. |
||
properties |
||
|
chosen_model |
|
Segmentation model name referencing a specific segmentation model in the model registry. |
||
type |
str |
|
default |
None |
|
|
extra_models |
|
Extra segmentation models to be used after the initial ‘chosen model’. |
||
type |
Optional |
|
default |
None |
|
|
export_regions |
|
If True, region masks are exported as one channel numpy arrays. |
||
type |
bool |
|
default |
False |
|
|
export_masked_images |
|
If True, images are exported with the segmentation region mask applied to the original image. |
||
type |
bool |
|
default |
False |
|
|
compute_region_areas |
|
If True, area will be computed for each segmentation mask and exported in CSV format. Note that all regions found in a mask will be combined and only one value for area is reported. |
||
type |
bool |
|
default |
False |
|
|
pixel_threshold |
|
Pixel threshold value below which intensity values will be set to zero for further computation such as fluorescence computation and cell counting. Values above and equal to the threshold value remain unchanged. |
||
type |
int |
|
default |
55 |
|
|
compute_fluorescence |
|
If True, a fluorescence score will be computed for each image and compiled into the dataset as a new variable ‘fluorescence_values’.When segmentation regions are provided, only the area within these regions will be considered. |
||
type |
bool |
|
default |
False |
|
|
color_channel |
|
Color channel to be quantified. Either 0, 1, or 2 (Red, Green, Blue). |
||
type |
int |
|
default |
1 |
|
|
export_annotations |
|
If True, segmentation region annotations will be exported to a CSV file in vgg16 format along with images. For more information on the vgg16 annotation standard, please see: https://www.robots.ox.ac.uk/~vgg/software/via/ |
||
type |
bool |
|
default |
False |
|
|
min_radius |
|
The minimum radius of blobs to detect given in meters. This value is displayed in micometers in the GUI. |
||
type |
float |
|
default |
4.4e-06 |
|
|
max_radius |
|
The maximum radius of blobs to detect given in meters. This value is displayed in micometers in the GUI. |
||
type |
float |
|
default |
2.18e-05 |
|
|
count_blobs |
|
If True, blobs will be detected and counted according to the minimum and maximum blob radius parameters. The Difference of Gaussian algorithm is used for efficient cell counting. |
||
type |
bool |
|
default |
False |
|
|
units |
|
SI unit used for exported data. Millimeters is used by default reporting lengths in millimeters and areas in square millimeters.’ |
||
type |
str |
|
default |
Millimeters |
|